Metrics
ProPR records every task and every model call. The Web UI turns those records into two surfaces — the dashboard for aggregate health and the LLM Log page for per-call detail — backed by JSON APIs you can query directly. This page covers where each number comes from, how cost is calculated, and how to read the numbers week to week.
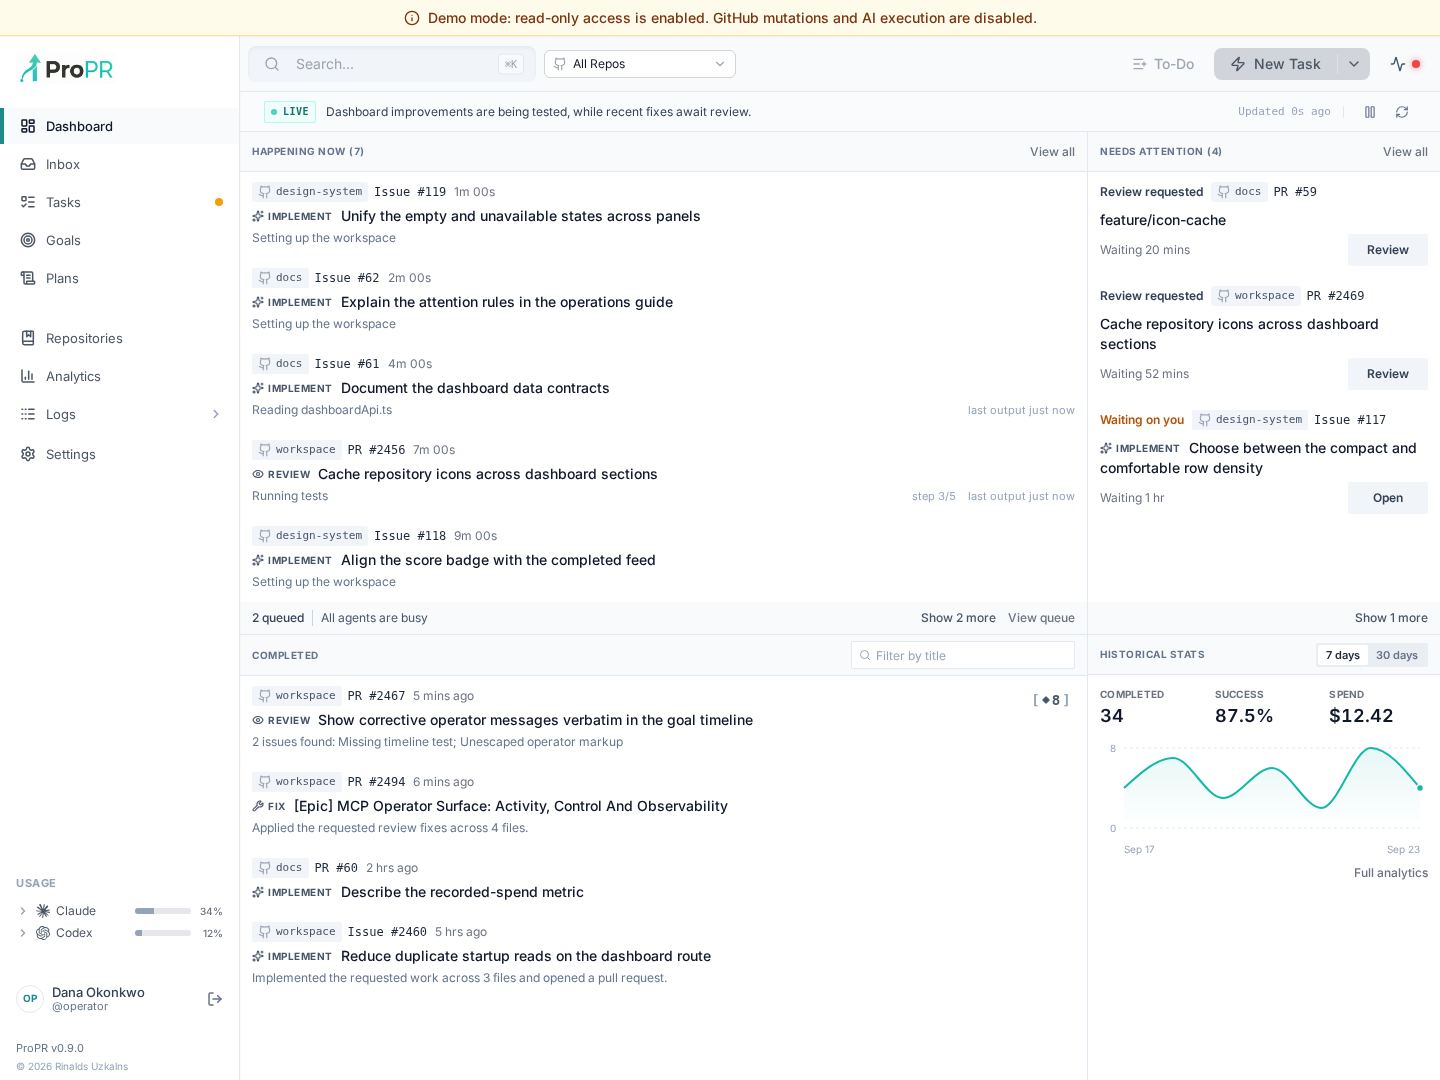
The Dashboard
The dashboard reads its own endpoints, each of which accepts repository=all or repository=owner/repo:
GET /api/dashboard/summary— the four summary counts (needs attention, running, queued, completed in the last 24 hours)GET /api/dashboard/attention— blockers and pending decisions, oldest first, derived from task and plan-issue state and never from notification read or dismissal stateGET /api/dashboard/active— running work with its lifecycle phase and latest reported progress line, plus a queue summary with the reason work is waiting when the backend knows oneGET /api/dashboard/outcomes— recent terminal results, including merges and closes recorded after the run finishedGET /api/stats/dashboard?period=7d|30d— tasks, success rate, recorded spend and daily task counts, with a previous-period comparison. It reads the same aggregation over the same window as the Analytics page for that period, so the dashboard's Historical stats and/analytics?period=7dalways agree. Goal tasks are left out of both, as the Completed feed and the task pages leave them out: a goal orchestrates the tasks that deliver its work rather than delivering any itself. Day periods (7d,30d,90d,1y) are whole UTC days ending today —7dis today and the six days before it, seven daily bars — while24his a rolling 24 hours. Thepreviouscomparison covers the same number of whole days ending the moment the current period starts, counted by task creation like the current figures, so a current period whose last day is still in progress is compared against a complete one and its figures can trail the previous period's until the day ends. The previous period ends exactly where the current one starts: a task created at the current period's first instant belongs to the current period only. The daily series isdailyTasks; thedailyCompletedseries (completions per day) that earlier releases reported is gone
The analytics page (/analytics) and the rest of the UI continue to read the aggregate endpoints:
GET /api/queue/stats— waiting, active, completed, failed, and delayed job counts from the BullMQ queueGET /api/stats/tasks— daily task counts (last 30 days), status distribution, and average processing time from the SQLite task historyGET /api/stats/repositories— per-repository totals, completed, failed, and in-progress counts with success ratesGET /api/stats/overview— completed and planned tasks, average PR iterations, total follow-ups, total tokens (with the input and output split and, asusage.cache, the prompt cache hit rate and estimated savings), total cost, and runs and tasks per model; eachmodel_usageentry also carriesmean_final_scoreandn_scoredfrom review scores. The olderusage.modelsmap is a different figure under a similar name — distinct tasks with at least one execution per model, not runs — kept for clients that predatemodel_usage, which the Models table labels Tasks when it has to fall back to it. It also reports run volume (runs), delivery (delivery) and autonomy (autonomy) — see Delivery metrics. The delivery, autonomy and review-quality aggregations read PR and task history, so the server reuses them between the page's refreshes: for up to ten seconds for a day period, and for up to a minute forperiod=all(or no period), which reads every PR's historyGET /api/stats/review-scores— review quality per implementer model (see Review scores)GET /api/status— daemon heartbeat, active worker count, Redis connectivity, GitHub App configuration, per-agent health, and indexing state
The dashboard refreshes these on task updates over the WebSocket connection, so the numbers track live activity. Unavailable data — a success rate with nothing finished, or spend on an instance that records no cost — is reported as null and rendered as "—" rather than as zero. For the screen layout, see the Web UI Guide.
Delivery metrics
The Analytics page reports task volume (the deliverables) and run volume (the compute) separately, in a delivery band under the totals:
| Figure | How it is computed |
|---|---|
| Runs per task | Agent executions started in the period (the Models table's runs, summed, its Unknown model row included) ÷ tasks worked on in the period (the totals band's Total tasks): the iteration multiplier. A task is a pull request with every run on it — the implementation, reviews, follow-up fixes and merge-conflict resolutions — grouped as the task list groups them; before a PR exists, its issue. Each task counts once, on the day of its first run in the period, and completed and failed count tasks with a run that completed or failed. Tasks that recorded no run still count, so tasks × runs per task equals the runs shown |
| First-time pass | Of pull requests opened by tasks in the period and merged, those that needed no fix before the merge: one implementation task for the issue (however many runs it recorded; a goal task naming the issue is not one), no follow-up fix task on the PR — an Ultrafix fix step included, scored or not; a review is not a fix, and neither is a merge-conflict resolution, which replays the same change onto a moved base — and no Ultrafix cycle after the first. Tasks created and cycles scored after the recorded merge are left out, so later work on the issue never changes a merged PR's verdict |
| Time to merge | Mean (and median) wall-clock time from the issue's first implementation task to the merge |
| Runs per merged PR | Mean agent executions across a merged PR's implementation attempts (every task on its issue, an attempt that opened no PR included) and follow-up tasks, started at or before the merge |
| Autonomy | Of tasks created in the period that finished, those that never failed (a failure counts even when a retry later completed the task) and never entered an attention state; the rest required an operator. Cancelled work is left out, and so are goal tasks, as the totals band leaves them out; unlike Total tasks, it counts each task run (implementation, review, fix) on its own |
| Cache hit rate | Prompt tokens served from the prompt cache ÷ all prompt tokens, over runs that reported a cache breakdown. The denominator is the input_tokens each run recorded, which already holds the whole prompt — uncached input, cache writes and cache reads — beside the separate cache counts, so a cached token is counted once. Savings price the cached reads at each model's official prompt price less its cache-read price; models without an official price are left out |
A figure with nothing behind it is shown as "—", never as zero.
The Activity chart plots the same two volumes day by day on one scale: each day has a pair of bars of equal width side by side, its runs in light slate and its tasks in dark slate (teal for today's tasks). A runs bar that towers over its tasks bar is an agent iterating on the same work; one level with it is work landing in a run or two. The pane heading carries the legend with each series' total for the period, and hovering a day shows its runs, tasks and runs per task in a card centred over that day, with a caret pointing at its taller bar. GET /api/stats/tasks reports a runs count beside each day's task count. For all time, the days start at the earliest task or run, so a planning run made before the first task is still drawn.
Breakdowns the product provides
- Per repository — the Repository Breakdown panel on
/analytics(andGET /api/stats/repositories) splits totals, completed, failed, in-progress, and success rate per repository. - Per model — the Models panel on
/analyticscounts runs (agent executions) per model, not tasks: one task usually takes several runs, often on different models, so a task is never credited to every model that touched it. Runs that recorded no model share one Unknown model row (model: nullinmodel_usage), listed last, so the panel's runs always sum to the delivery band's total and the Activity chart. The aggregated metrics API adds requests, success rate, cost, turns, and execution time per model. - Per call — the LLM Log page filters by execution type, model, status, and work type, and records the agent alias for every call.
Three overview numbers approximate outcome quality: success rate (completed tasks over total), average PR iterations (tasks per issue), and total follow-ups. Rising iterations and follow-ups mean humans are spending more effort steering each PR.
The daily glance
Check these on the dashboard each day:
- Queue depth (waiting and active counts)
- Active workers and daemon status (header system status)
- Anything blocked or awaiting a decision (the dashboard's Needs attention panel)
- Completed work (the dashboard's Completed feed)
- Long-running jobs (Happening now, and the header activity monitor)
- Failure spikes (failed runs in Needs attention and the status distribution on
/analytics) - Top model usage (Top Models panel on
/analytics) - Cost trends (Recorded spend plus the LLM Log page)
The LLM Log Page
Every LLM execution is recorded in the SQLite llm_logs table and shown on the LLM Log page in the Web UI. Each entry records:
- Execution type (implementation, plan generation, PR review, and so on)
- Model name and agent alias
- Work reference — the task, plan, PR, or repository the call belongs to
- Input/output token counts and cache creation/read tokens
- Estimated cost in USD
- Duration, start/end time, and success or failure state
- Session ID and correlation ID
- Error message on failure
- Agent Tank usage deltas per call, when Agent Tank is enabled
Filter the list by status (success/failed), work type (task/plan/repository), execution type, and model. Expand a row to see the repository, session and correlation IDs, cache statistics, and the error message for failed calls. The data is paginated through GET /api/llm-logs.
Providers differ in what they expose. ProPR normalizes what it can and leaves provider-specific gaps visible (for example, token counts may be null for some agents).
This is the page to use when comparing model costs across real work or investigating an unexpectedly expensive run.
Aggregated metrics API
The API also aggregates run metrics in Redis, available at GET /api/llm-metrics:
- Totals: requests, successes, failures, success rate, cost, turns, and average execution time
- Per-model breakdown: requests, success rate, total and average cost, turns, and execution time per model
- Daily metrics for the last 7 days (successful/failed counts and cost per day)
- The 10 most recent high-cost alerts
watchdogTrips: agent runs stopped by the stall/degenerate-output watchdog, per rule (inactivity,tool_inactivity,degenerate_output)
GET /api/llm-metrics/<correlationId> returns the detailed metrics for a single run.
Review scores
Every /review and every Ultrafix review cycle ends with a Score: N/10 line. ProPR stores each parsed score in the review_scores table, so you can ask which model writes the pull requests that review best, at what cost, on a given repository. A review that fails or does not follow the review contract has no score and writes no row. Scores recorded before this table existed are not backfilled.
Schema
| Column | Meaning |
|---|---|
id | Row identity |
repository_id | Repository full name (owner/repo), the key the repositories and tasks tables use |
pr_number | The reviewed pull request |
task_id | The review task that produced the score |
implementation_task_id | The task that opened the pull request (the earliest non-follow-up task recorded with this PR number), or null if ProPR did not open it |
implementer_agent, implementer_model | Agent and model of that task, resolved when the score is written. The model is the one the task's LLM executions recorded, so it matches the overview's model names |
reviewer_agent, reviewer_model | The agent and model that ran the review, after synthetic routing |
score | 1–10, as the review parser reads it. A review that still lists merge blockers is capped at 6, the same score the published comment and the Ultrafix goal check use |
blocker_count, suggestion_count | Number of F# blockers and S# suggestions in the review |
cycle_number | The Ultrafix review cycle; null for a plain /review |
goal | The Ultrafix goal in effect for that cycle; null for a plain /review |
goal_reached | Whether the cycle's whole review job reached the goal, judged as the Ultrafix loop judges it: every reviewer posted a complete, valid, scored review, none reported a blocker, and the newest review's score met the goal. The same on every row of one cycle; null for a plain /review |
source | review or ultrafix |
head_sha | The reviewed head commit |
created_at | When the score was recorded (ISO 8601, UTC) |
When a pull request is merged or closed, the webhook handler records the outcome on the PR's existing notification_pull_request_state row: outcome (merged or closed), closed_at, and the existing merged_at. Reopening a closed (unmerged) PR clears the outcome again.
Endpoints
GET /api/stats/review-scores?period=&repository=— one entry per implementer model.periodtakes the Analytics timeframes (24h,7d,30d,90d,1y,all) and bounds which scores count by when they were recorded;repositoryisall(the default) orowner/repo.GET /api/stats/review-scores.csv?period=&repository=— the same summary as CSV, one row per model; an unknown value is an empty cell.GET /api/pull-requests/<number>/scores?repository=owner/repo— one PR's score history, oldest first (cycle, source, score, goal, blocker and suggestion counts, reviewer model, head SHA, timestamp), with its recorded outcome.
The pull request is the unit. Each per-model entry reports:
| Field | How it is computed | Denominator n |
|---|---|---|
prs_scored | Pull requests with at least one score in the period | — |
first_score.mean, first_score.median | The earliest score in each PR's whole history, including scores before the period; for a merged PR, its earliest at or before the merge. The same starting point score_delta runs from, so the final score less the delta is always this figure | PRs with an initial score (a merged PR with no score at or before its merge is unknown and excluded, as it is from the final score) |
final_score.mean | The last score recorded at or before the merge, including scores before the period; for a PR that was not merged, its latest score | PRs with a final score (a merged PR with no score at or before its merge is unknown and excluded) |
cycles_to_goal.mean | The Ultrafix cycle of the first review job that reached the goal (goal_reached); a clean reviewer does not pass a cycle another reviewer blocked | PRs that reached the goal; attempted counts PRs with an Ultrafix goal |
merge_rate.value | Merged ÷ (merged + closed). Open PRs have no outcome yet | PRs merged or closed |
cost_per_merged_pr.usd | Mean recorded cost per merged PR (see below) | Merged PRs with recorded cost |
score_delta.mean | Mean of each PR's final score minus its initial score (first_score): whether follow-up work improved the code. Both ends come from the PR's whole score history, not only the period, and a merged PR's from its scores at or before the merge, so the change always runs forward in time | PRs with a final score |
runs_to_merge.mean | Mean agent executions across a merged PR's implementation attempts and follow-up tasks, started at or before the merge, attached as the delivery band's Runs per merged PR attaches them: an earlier attempt at the same issue that opened no PR counts, a goal task does not | Merged PRs with recorded runs |
Every figure carries its own n. A figure with nothing behind it — no merged PRs, no recorded cost, no Ultrafix goal — is null, never 0. PRs whose implementer is unknown are grouped under implementer_model: null, which the Analytics page labels Manual / Untracked: the PR was written by hand, or by an agent run ProPR did not record.
Cost per merged PR sums llm_executions.cost_usd over every task attached to the pull request: its implementation attempts (the task that opened it and any earlier attempt at the same issue) and every task that acted on the PR afterwards (follow-ups, /fix, Ultrafix fixes and reviews, merge-conflict resolution). The cost is the PR's whole recorded spend, not only the spend inside the period. A merged PR none of whose executions recorded a cost is left out of the mean and of n, rather than counted as free.
The Analytics page shows the summary as Agent efficacy by model — evaluated PRs, initial score, final score, score delta, average runs to merge and merge rate — using the page's ?period= timeframe. Each cell shows one figure; the PRs behind it are in the cell's tooltip. Task details on a PR show its score history as a step on the task timeline, after every run: the scores in sequence (for example 4 — 6 — 8), each in its grade's colour (red 0–4, amber 5–6, slate 7–8, teal 9–10), and a list. Once the PR is merged or closed and no run is still working or queued, that outcome is the timeline's last entry. From the CLI, propr stats review-scores [--period 30d] [--repository owner/repo] [--json] prints the same summary, and the MCP get_pull_request tool includes the PR's scoreHistory.
Cost Tracking
ProPR estimates the cost of every LLM call from its token counts (input, output, cache creation, and cache read) and per-model pricing, then stores the estimate with the call. All cost figures in the UI come from these per-call records: the LLM Log shows cost per call, and the dashboard's Spend is the sum of recorded execution costs for the selected period.
For directly supported Claude and OpenAI models, ProPR uses the providers' published standard API rates. Other models fall back to the OpenRouter model feed. Cache reads and cache creation are priced separately when the provider or feed publishes those rates; Claude cache creation uses the default 5-minute write rate. The token total shown beside each call includes ordinary input, output, cache creation, and cache reads, so it reconciles with the cost estimate. Provider options that change the rate but are not reported by the CLI, such as regional routing or fast mode, are not included.
Reasoning effort changes how many thinking/output tokens a model uses; it does not apply a separate price multiplier. Provider usage reports already include reasoning tokens in output_tokens, so ProPR bills that output once and records the effective reasoning level in the expanded log details. Codex also reports the reasoning-token subset there when available. A higher effort setting can therefore cost more because it produces more billed output, not because each token has a different rate.
When a single run crosses the cost threshold (LLM_COST_THRESHOLD_USD, default 10.00), ProPR records a high-cost alert; the 10 most recent appear in the aggregated metrics summary. Investigate when:
- A single run exceeds the expected cost
- A loop repeats too many times
- One repository becomes unusually expensive
- A provider starts returning rate-limit errors
A cost spike should lead to an action: smaller task scope, a different model, or loop limits.
LLM_COST_THRESHOLD_USD only alerts. To enforce a limit, set a per-run spend cap; a run whose estimated cost reaches it is stopped and its partial work published:
| Precedence | Where | Value |
|---|---|---|
| 1 (highest) | Per task: maxCostUsd on task submissions and MCP create_task, or propr issue implement --max-cost | USD |
| 2 | Repository: limits.max_cost_usd in .propr/workflow.yml | USD; 0 = no cap from the file |
| 3 | Instance: default_max_cost_usd (Settings → Workflow & PR Rules, propr setting update default_max_cost_usd) | USD; empty or 0 = no cap |
The cap covers implementations, PR follow-ups, /fix, ultrafix cycles and reviews. Spend counts the task's recorded LLM calls plus the usage its running agent containers have streamed so far. A malformed or negative value is ignored with a warning (treated as no cap at that level). Retries share the budget: a re-queued attempt (provider usage-limit re-queue or BullMQ retry) may only spend what earlier attempts of the task left. A run stopped at its cap gets the terminal reason cost_cap_exceeded, a budget.exceeded timeline event, an Inbox notification and a short issue/PR comment; task details and propr task get --json show the cap, the spend and the percentage. See Spend caps.
Provider capacity (Agent Tank)
Subscription plans meter capacity in session and rate-limit windows. To track those, ProPR integrates with Agent Tank, an optional local service that reports session and rate-limit usage for Claude, Codex, and Antigravity CLI tools. When enabled, the sidebar shows per-provider usage bars with reset countdowns, which the API samples every 30 seconds and pushes when they change, and each LLM log entry records the usage delta the call consumed. The integration is best-effort: if the service is unreachable, tasks proceed normally and the sidebar hides itself.
See Agent Tank Usage Tracking for how to run it, connect ProPR, and read the bars.
Reading The Numbers Weekly
Review these signals weekly, and weight trends more heavily than one-off failures:
- Success rate and failure volume — the dashboard stats grid and status distribution
- Per-repository health — Repository Breakdown on
/analytics; a repository with a below-average success rate needs attention before more work is routed to it - Time to done — the average processing time chart (
GET /api/stats/tasks); individual task records show per-run duration - Human steering effort — average PR iterations and total follow-ups from the overview stats
- Cost — Spend on the dashboard, the per-model and daily breakdowns from
GET /api/llm-metrics, and the recent high-cost alerts
Failure analysis
For each recurring failure pattern, use the task record — failure context, the exact prompt, execution logs, and the event log — to identify:
- Where the failure happened (queue, git setup, agent execution, finalization)
- Which repositories or agents are affected
- Whether the task was too broad
- Whether context was missing
- Whether credentials, routing, or rate limits were involved
Many recurring failures trace back to planning scope, routing, missing context, or operations settings — check those before blaming model quality.
Turning patterns into changes
Common improvement actions:
- Split larger tasks earlier in Planner Studio
- Add repository summaries or refresh indexing
- Change the default agent or review model
- Tune worker concurrency (
WORKER_CONCURRENCY) - Adjust agent timeout settings
- Improve PR follow-up instructions
Operational signals
Between reviews, the live dashboard flags incidents:
- Sudden queue growth (waiting count in queue stats)
- Repeated provider rate-limit failures
- Authentication failures after credential changes (agent health in the header status)
- Cost spikes (dashboard Spend and recent high-cost alerts)
- A specific repository causing disproportionate failures (Repository Breakdown on
/analytics) - Provider capacity pressure (Agent Tank usage bars, when enabled)
Related Pages
- Observability And Control — what a run leaves behind and how to recover
- Web UI Guide — the anatomy of every screen